Northstar RevOps
A live revenue-operations command center exploring how a SaaS team can scan pipeline health, switch forecast scenarios, isolate regional risk and move from summary metrics into a deal-level decision.
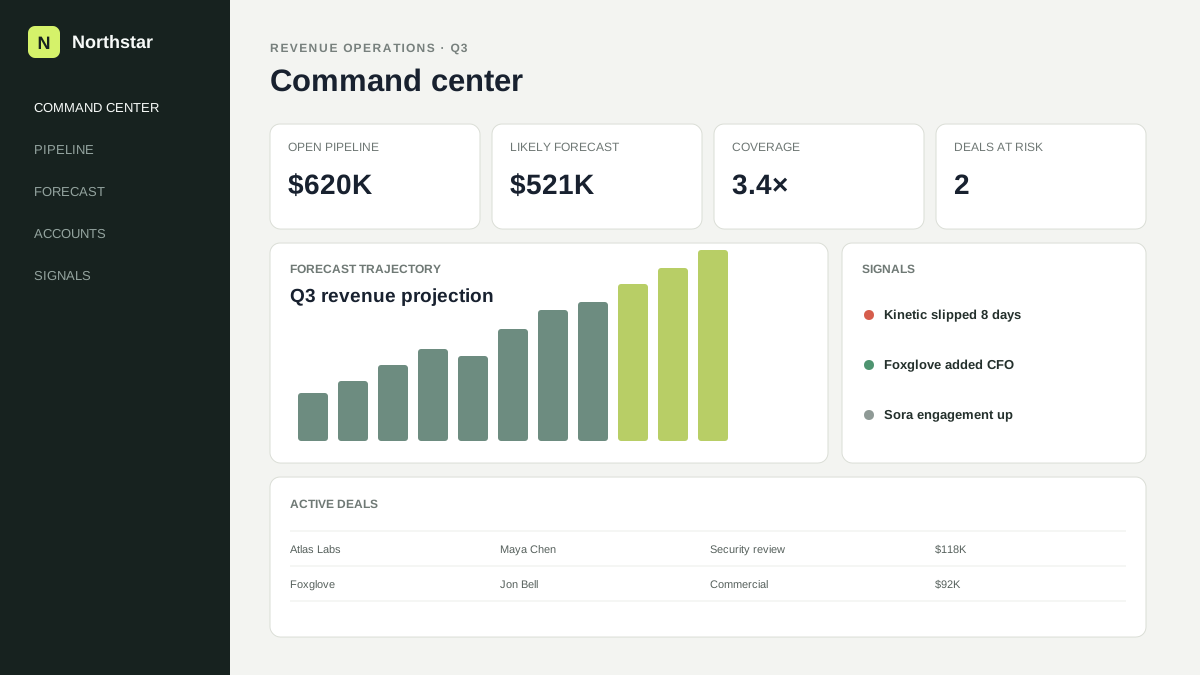
A realistic product problem, not a decorative dashboard brief.
Revenue teams work with dense pipelines, changing confidence levels and mixed-risk opportunities. A useful command center has to keep summary metrics, signals, filtering and deal detail connected without turning the screen into a wall of equally weighted numbers.
Product framing, interface design and working prototype.
I framed the workflow, designed the hierarchy and interaction model, implemented the responsive prototype and added working scenario, search, region-filter and watchlist states.
The interface is organized around decisions and state changes.
The concept is intentionally interactive so the design can be judged against a real task flow instead of only a polished screenshot.
Open pipeline, forecast, coverage and risk are grouped as decision signals rather than decorative KPI cards.
Commit, Likely and Upside states recalculate the projection so scenario planning is visible in the interface.
Region and search controls update both the visible deals and summary metrics instead of acting as isolated table filters.
The detail drawer keeps health, ARR, stage, region and risk reasoning together, then exposes a watchlist action.
System choices are tied to operational use.
The goal is not to claim invented conversion or efficiency gains. The case shows the reasoning and interaction model that can be evaluated directly in the live prototype.
Small type, restrained borders and a limited accent palette keep many data points scannable while preserving hierarchy.
Risk labels, exposed ARR and signal copy provide textual context so status is not communicated by color alone.
Filters recalculate the top-level numbers, reinforcing that dashboard metrics are a view of the current working set.